One of the main features of a comprehensive application is diagnostic logging. Logging is the primary tool that allows us to closely observe the health of the application itself. .NET Core applications come with built-in logging, and there are many third-party packages available that enable amazing features in a very simple way. One such tool is Serilog, which adds structured event logging functionality to search across multiple events more easily. In the previous note, Jekyll Contact Form with a .NET Core Microservice, we introduced a very simple microservice ATech.ContactFormServer (too simple to be called a proper microservice, I know ![]() ), that already uses Serilog. Having a look at the application’s configuration file, we will notice that Microsoft’s Logging configuration section:
), that already uses Serilog. Having a look at the application’s configuration file, we will notice that Microsoft’s Logging configuration section:
  "Logging": {
    "LogLevel": {
      "Default": "Warning"
    }
  },
has been replaced by a Serilog’s one:
"Serilog": {
    "Using": [
      "Serilog.Sinks.Console"
    ],
    "MinimumLevel": {
      "Default": "Information",
      "Override": {
        "Microsoft": "Warning",
        "System": "Warning"
      }
    },
    "WriteTo": [
      {
        "Name": "Console",
        "Args": {
          "theme": "Serilog.Sinks.SystemConsole.Themes.AnsiConsoleTheme::Code, Serilog.Sinks.Console"
        }
      },
      {
        "Name": "File",
        "Args": {
          "path": "log-.log",
          "rollingInterval": "Day"
        }
      }
    ],
    "Enrich": [
      "FromLogContext",
      "WithMachineName",
      "WithThreadId"
    ]
  }
Tons of articles and tutorials can explain how to set up and use Serilog, and the focus of this note is not about it, but exploring some possible scenarios for centralized structured logging. The example provided is perfect for a single, or very few applications running on a On-Premise machine.
It provides a Console Logging
    "WriteTo": [
      {
        "Name": "Console",
        "Args": {
          "theme": "Serilog.Sinks.SystemConsole.Themes.AnsiConsoleTheme::Code, Serilog.Sinks.Console"
        }
      },
      ...
    ]
perfect for debug sessions, and a Rolling File sink
    "WriteTo": [
      ...,
      {
        "Name": "File",
        "Args": {
          "path": "log-.log",
          "rollingInterval": "Day"
        }
      }
    ]
which can be used in a small on-premises production environment, but becomes very hostile when there are many web applications, microservices, and so on running on-premises and in cloud hosting.
The ELK way
A viable solution, offered by Serilog, is Serilog.Sinks.ElasticSearch that allows writing our diagnostic log to an Elasticsearch database that can be easily deployed on a Linux Machine.
ELK machine setup
For demo purposes we will deploy a Linux Debian machine on Azure. We can reach our goal in many ways but the one I prefer is Azure CLI.
First of all we have to login our Azure account.
~ az login
Following the instructions in the article Install the Elastic Stack on an Azure VM I have put down a simple bash script that will carry out the virtual machine deployment job:
#!/bin/bash
location="switzerlandnorth"
identifier=atech-log

resource=rg-$identifier
server=srv-$identifier
nsgSfx=NSG
nsg=$server$nsgSfx
size=Standard_D2d_v4

echo "Creating resource group $resource..."
az group create --name $resource --location "$location"

echo "Creating Virtual Machine $server ..."
az vm create --resource-group $resource --name $server --image Debian --admin-username alien --generate-ssh-keys --size $size

echo "Opening port 9600 for Elastic Search on $nsg ..."
az network nsg rule create --resource-group $resource --nsg $nsg --name elasticsearch-security-group-rule --protocol tcp --priority 100 --destination-port-range 9200

echo "Opening port 5601 for Kibana on $nsg.."
az network nsg rule create --resource-group $resource --nsg-name $nsg --name kibana-security-group-rule --protocol tcp --priority 110 --destination-port-range 5601
The above instructions will deploy the virtual machine making ports 9200 and 5601 accessible via TCP to allow external access to Elasticsearch and Kibana respectively.
With the virtual machine up and running all we need to do is connecting to it via ssh and install the ELK stack.
Install Elasticsearch
To install the database service we will use the following commands.
sudo apt update && sudo apt install apt-transport-https
sudo apt install gnupg
wget -qO - https://artifacts.elastic.co/GPG-KEY-elasticsearch | sudo apt-key add -
echo "deb https://artifacts.elastic.co/packages/7.x/apt stable main" | sudo tee -a /etc/apt/sources.list.d/elastic-7.x.list
sudo apt update && sudo apt install elasticsearch
To configure the service we will edit the file /etc/elasticsearch/elasticsearch.yml and uncomment the following values
network.host: 0.0.0.0
http.port:9200
cluster.initial_master_nodes: [10.0.0.4]
To start the elasticsearch service
sudo systemctl start elasticsearch.service
To test if the service is up and running we will use the following command
sudo curl -XGET 'localhost:9200/'
If everything’s ok the output will be something like:
{
  "name" : "srv-atech-log",
  "cluster_name" : "elasticsearch",
  "cluster_uuid" : "6TwauX8eR9-WRp44RF5myQ",
  "version" : {
    "number" : "7.10.0",
    "build_flavor" : "default",
    "build_type" : "deb",
    "build_hash" : "51e9d6f22758d0374a0f3f5c6e8f3a7997850f96",
    "build_date" : "2020-11-09T21:30:33.964949Z",
    "build_snapshot" : false,
    "lucene_version" : "8.7.0",
    "minimum_wire_compatibility_version" : "6.8.0",
    "minimum_index_compatibility_version" : "6.0.0-beta1"
  },
  "tagline" : "You Know, for Search"
}
To test if the service is accessible from outside the virtual machine we will use the same command but with the Virtual Machine’s public IP address.
Install Logstash
The second letter in the ELK acronym is the initial of Logstash to install which will use the following commands:
sudo apt install default-jre && sudo apt install logstash
Install Kibana
The last letter and last service to install is Kibana, the graphical interface to visualize and search the data stored in Elasticsearch.
sudo apt install kibana
Edit /etc/kibana/kibana.yml, uncomment the server.host and assign the value 0.0.0.0 value to it.
server.host: "0.0.0.0"
Start the service with the command
sudo systemctl start kibana.service
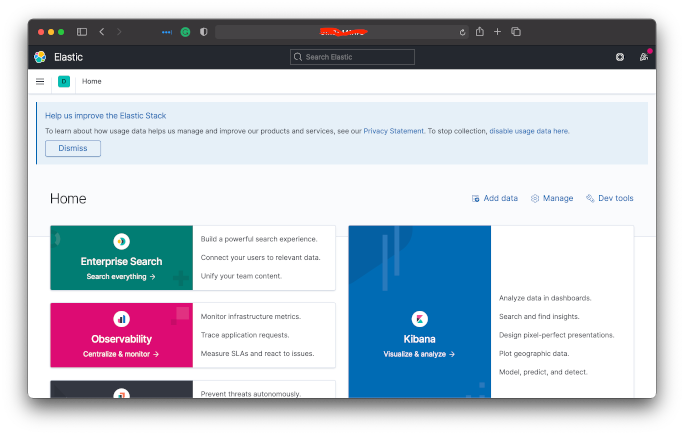
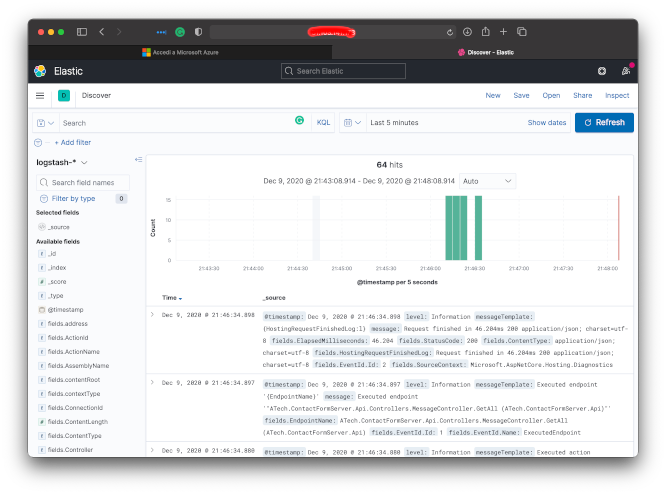
If everything is fine and the server is working, we will navigate to the address http://public-server.ip:5601/ on the browser of our choice and will see:

and then

Serilog configuration
The last step is to add a new sink to the Serilog logger. We can do it by code, adding the WriteTo.Elasticsearch in the Program.cs file
...
            Log.Logger = new LoggerConfiguration()
                .ReadFrom.Configuration(Configuration)
                .WriteTo.Elasticsearch(new ElasticsearchSinkOptions(new Uri(uri))
                {
                    AutoRegisterTemplate = true,
                })
                .CreateLogger();
...
or, configuring it in the application configuration file:
      ...
      {
        "Name": "Elasticsearch",
        "Args": {
          "NodeUris": "http://*51.**3.**1.**8:9200",
          "EmitEventFailure": "WriteToSelfLog",
          "AutoRegisterTemplate": true
        }
      }
      ...
Done! Our centralized ELK logging server is operating and it’s collecting our logs.

Enjoy, ![]()
